Inputs
Building use, area, element groups, assemblies, quantities, room geometry, glazing, location and study period.
Methodology
CASCA turns available design information into comparable embodied carbon, operational energy, comfort and whole-life carbon outputs. The method is designed for option appraisal before a full project model is resolved.
Method overview
CASCA keeps the calculation basis consistent so design options can be compared on direction, sensitivity and trade-offs rather than treated as isolated estimates.
Building use, area, element groups, assemblies, quantities, room geometry, glazing, location and study period.
Declared material data, practical quantity rules, operational energy assumptions and room-scale simulation outputs.
Embodied carbon, operational energy, comfort indicators, whole-life totals, intensities and rating-style context.
Scenario comparison, hotspot review and transparent assumptions for design, research and teaching decisions.
Scope
CASCA is intended for comparing facade, construction and building options while design choices are still open. It helps teams review likely direction and trade-offs without waiting for a fully detailed BIM, full LCA submission or compliance model.
Boundaries
CASCA does not replace formal project LCA, multi-zone whole-building energy modelling, mechanical design, system sizing or compliance reporting. Results should be used as structured early-stage evidence and reviewed against project-specific assumptions before formal reporting.
Assessment routes
The building workflow and room workflow use different levels of input detail, but both are arranged around transparent assumptions and comparable carbon outputs.
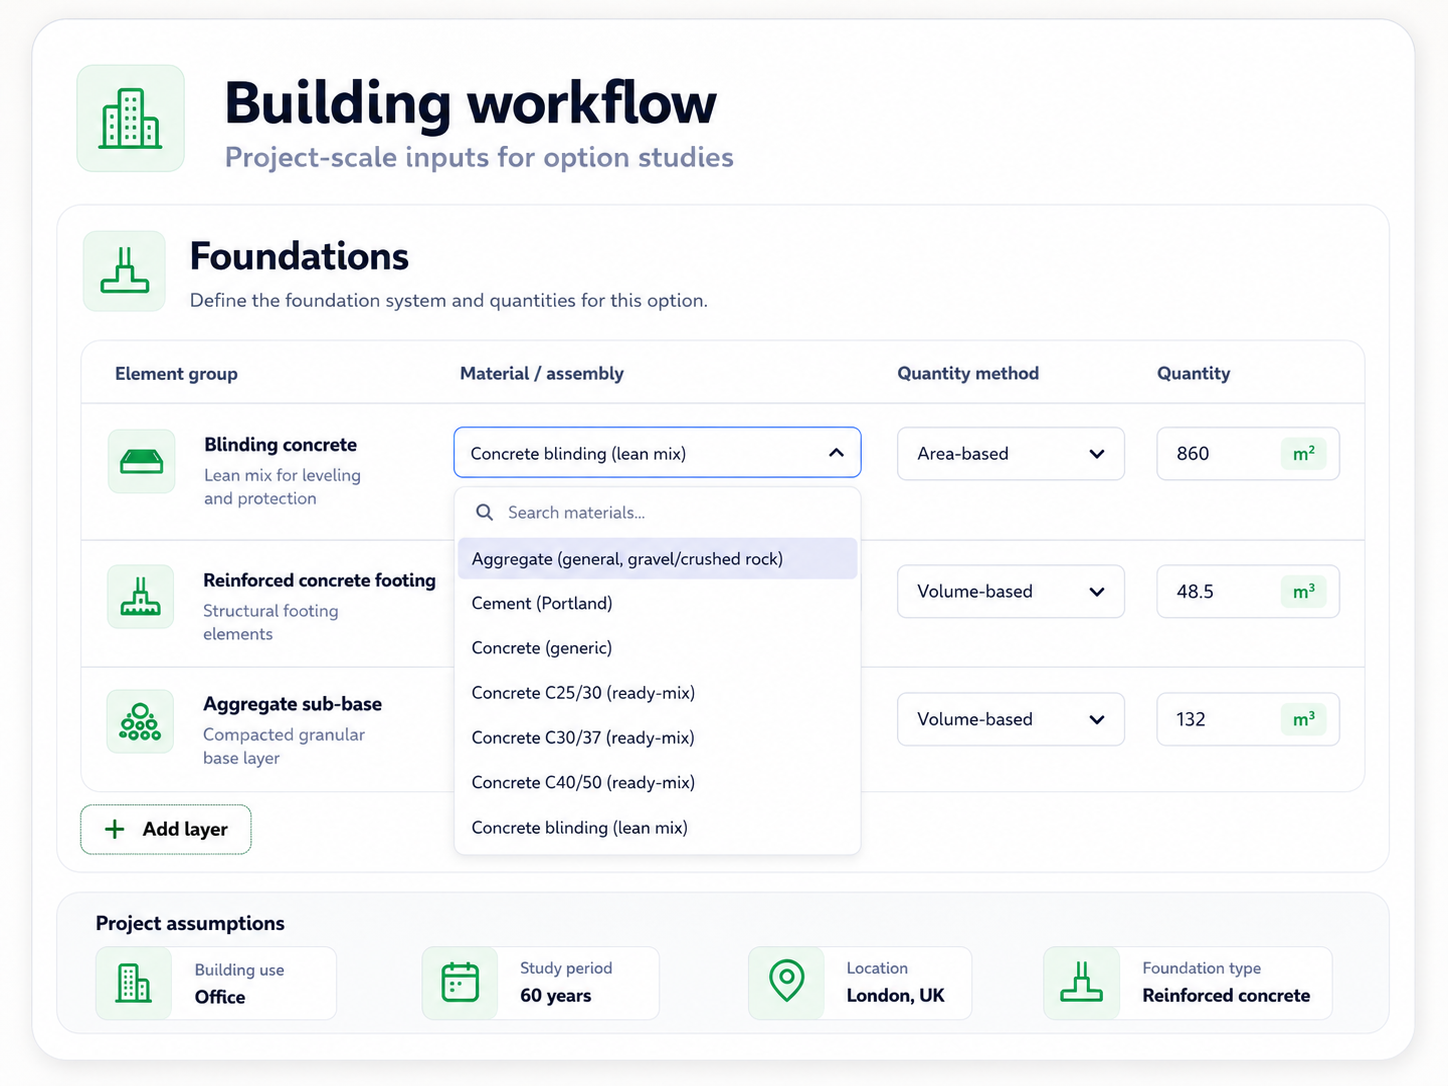
Building workflow
Use gross internal area, building use, selected element groups, assemblies, quantities and operational energy assumptions to compare whole-building embodied, operational and whole-life carbon results.
Room workflow
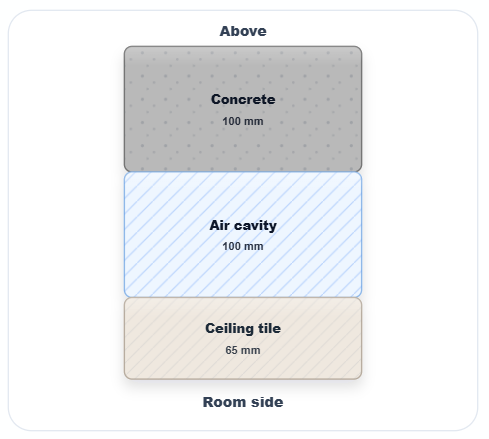
Use a single-zone shoebox model to test room geometry, facade orientation, room build-ups, window-to-wall ratio, glazing and internal gains.
Lifecycle modules
CASCA organises impacts around recognised lifecycle module terminology so users can see whether a result is driven by product-stage impacts, transport and construction, replacements, operational energy or end-of-life assumptions.
Included where the selected material or assembly factor reports product-stage emissions.
Included where the selected source explicitly declares these stages; otherwise they are not silently inferred.
Included when declared, or estimated transparently for selected facade/glazing assumptions where a service-life basis is used.
Calculated from delivered or estimated annual energy and location-relevant carbon factors.
Included where declared, with conservative assumptions used only where the selected method states them.
Coverage depends on the data source, so assumptions and module boundaries should be reviewed before formal reporting.
Output interpretation
CASCA outputs help teams understand relative performance, not just isolated numbers. The strongest use is comparing scenarios under the same location, study period, module boundary and reporting basis.
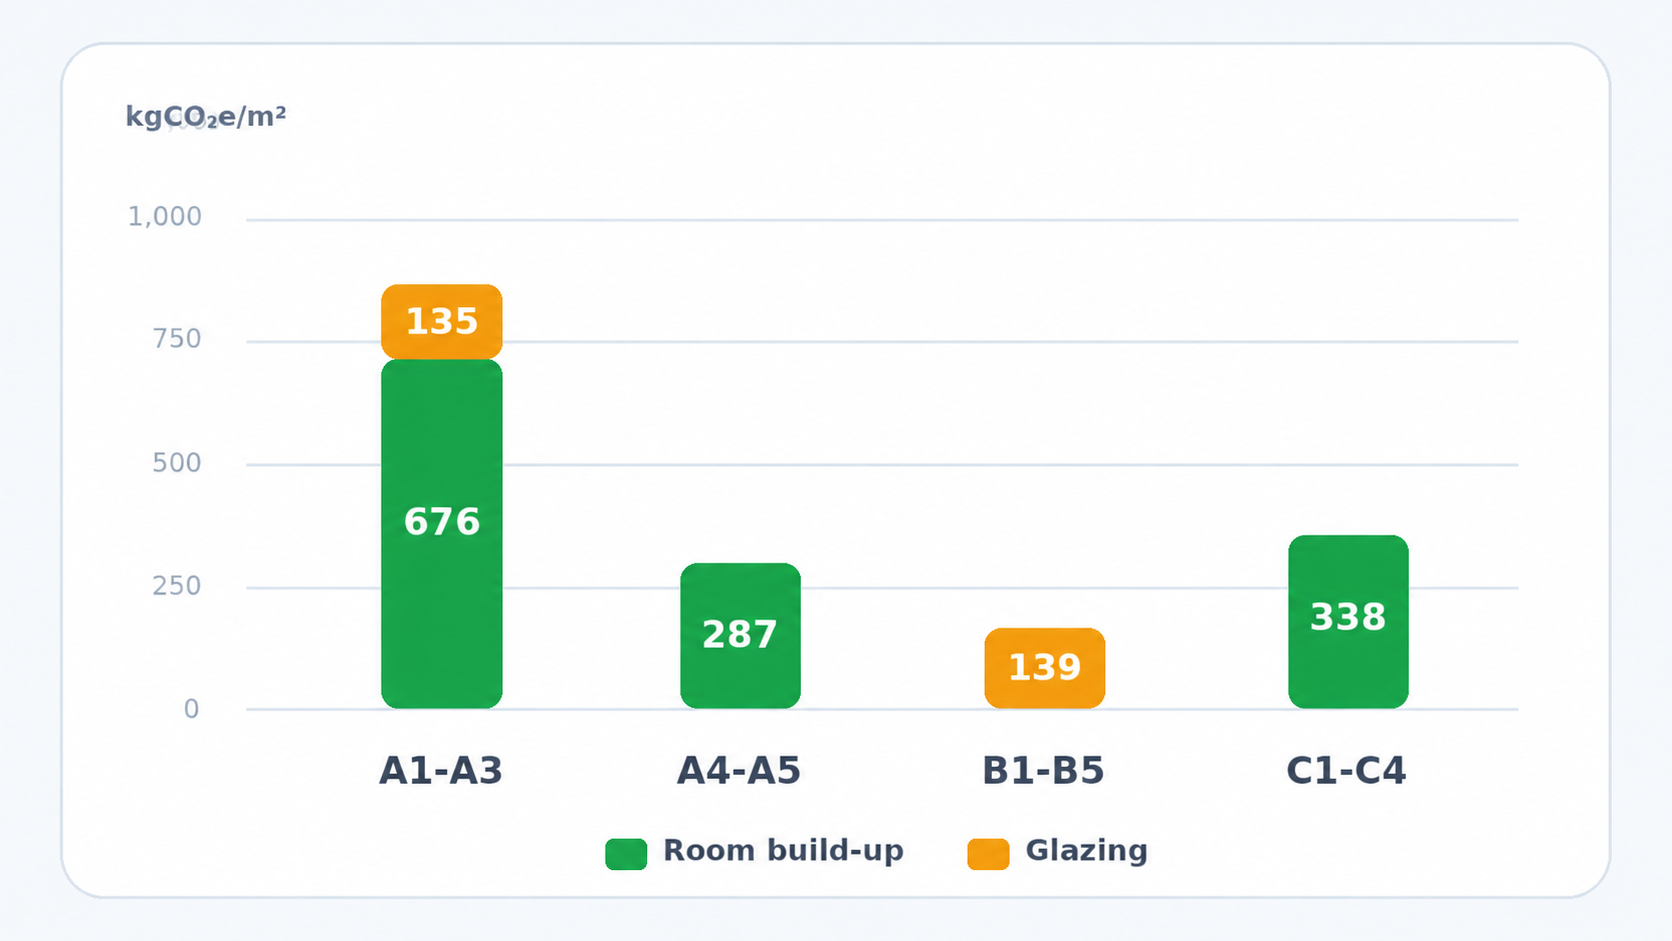
Material and assembly quantities are multiplied by the selected factor basis, then grouped into clear totals, intensities and module breakdowns.
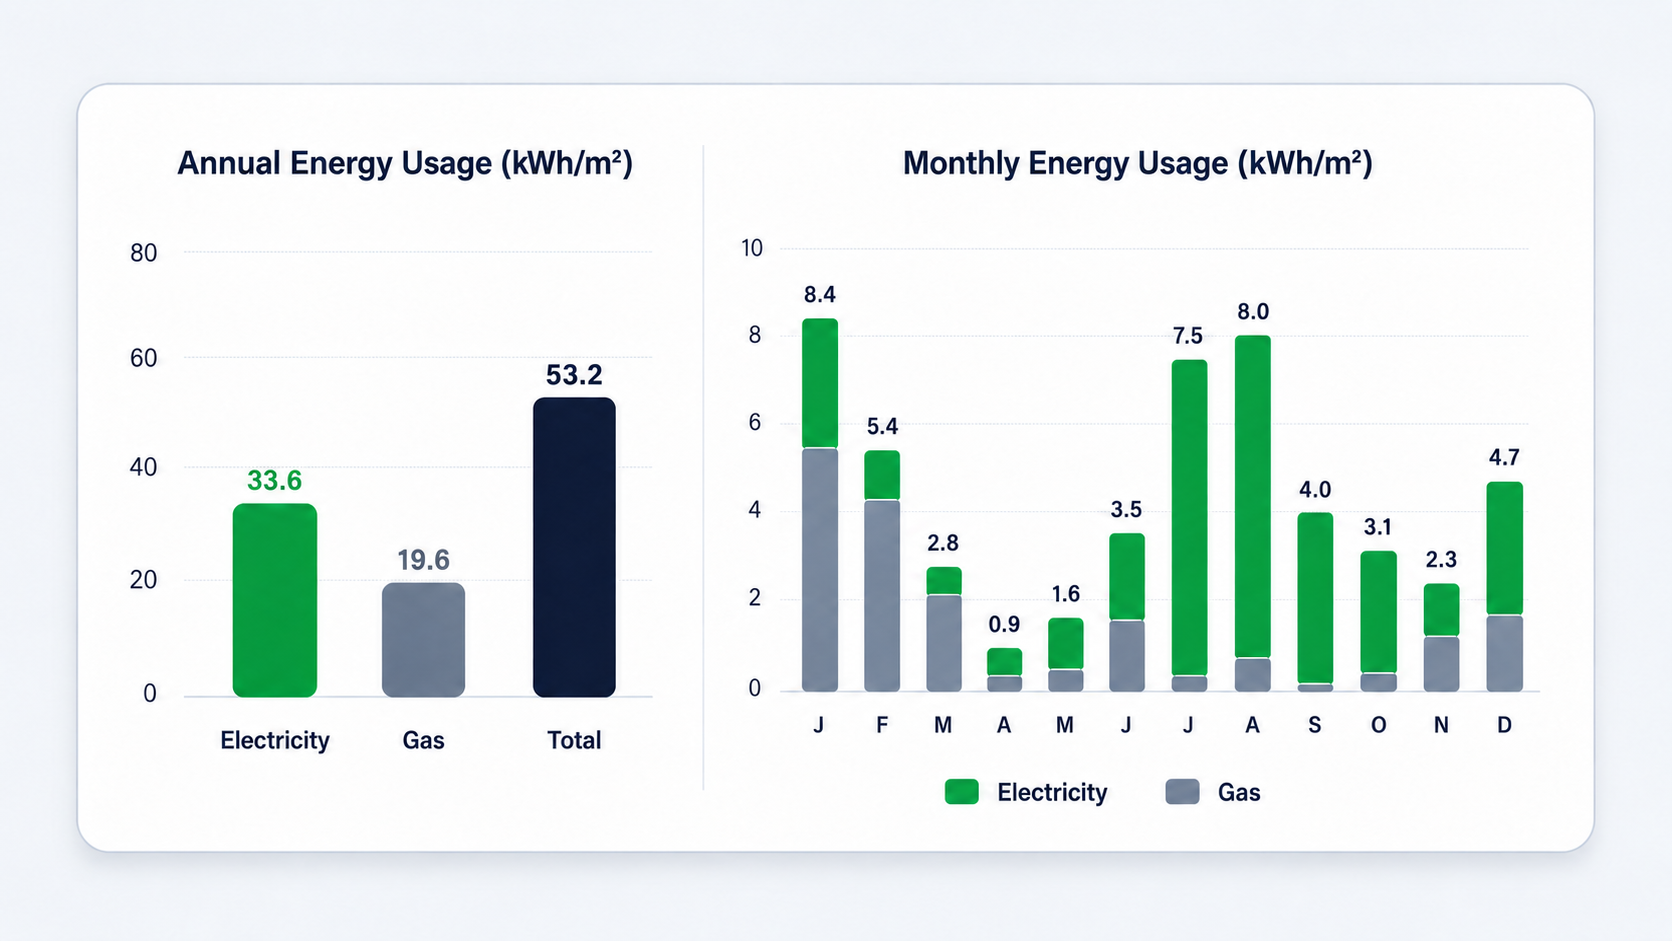
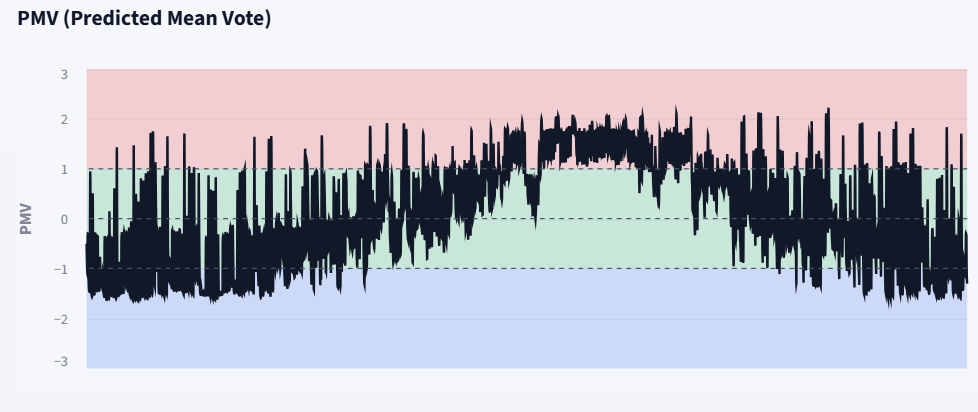
Building workflow energy can use EUI, annual kWh, storey-based values or an EPC-style proxy. Room workflow outputs come from dynamic simulation.
Comfort charts should be reviewed with occupied-hour filtering where the question concerns occupant experience.
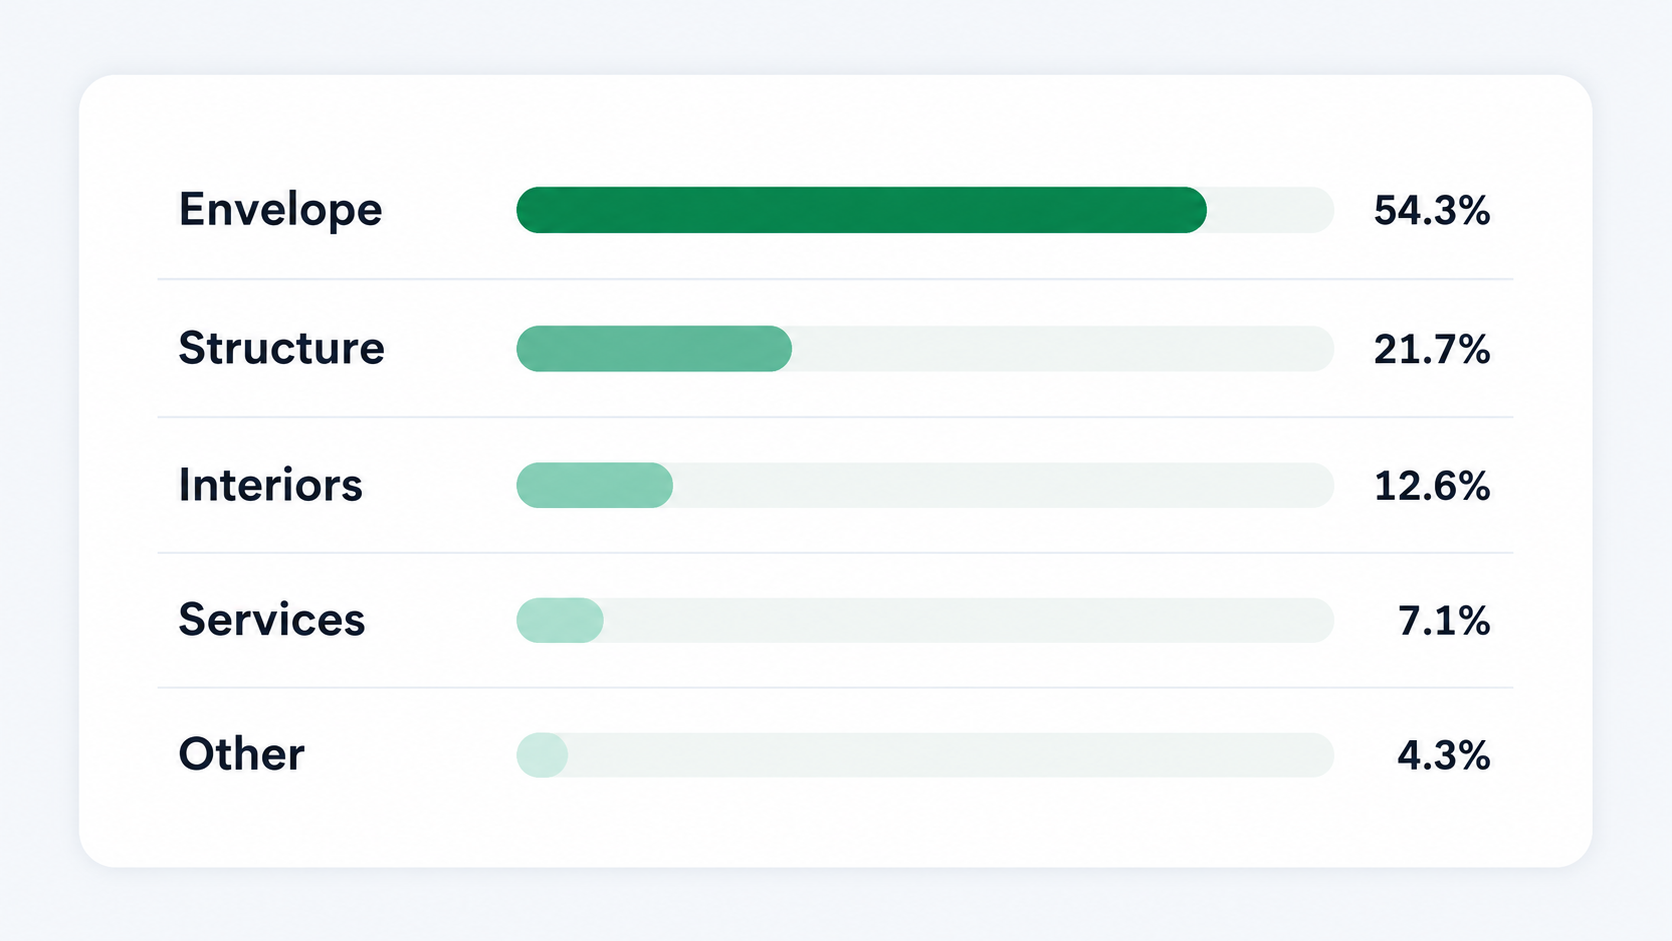
Hotspot charts help users identify which element groups, modules or assumptions are driving the result.
Quality assurance
For robust option studies, scenarios should be checked against the same location, reference study period, carbon-factor basis and reporting units. Assembly factors should be reviewed for consistent units and declared module boundaries.
Recommended checks
Discuss early-stage whole-life carbon comparison, facade workflows, research use or teaching access.